Advance Query Reports
Note
QMetry Insight module is visible only if the user has the View and Modify rights for QMetry Insight.
Advance Query Reports of QMetry Insight is designed for technical users with SQL knowledge who can write SQL queries and generate custom reports. The Advance Query view gives more power and flexibility to the users by providing them the ability to create custom reports by writing basic to complex SQL statements.
The interface is divided into two main sections. The left panel contains a list of tables and their fields, representing consolidated QMetry data needed for reporting. This data is accessible in just 15 tables which are synced in real-time. For making the query creation easier the names of the tables have a resemblance with QMetry test assets and different modules.
Understanding Screen Layout
The QMetry Insight module consists of the Query Builder. The query builder is used to create custom queries and add filters to generate reports accordingly. This document includes details about how to create Custom Reports using SQL query.
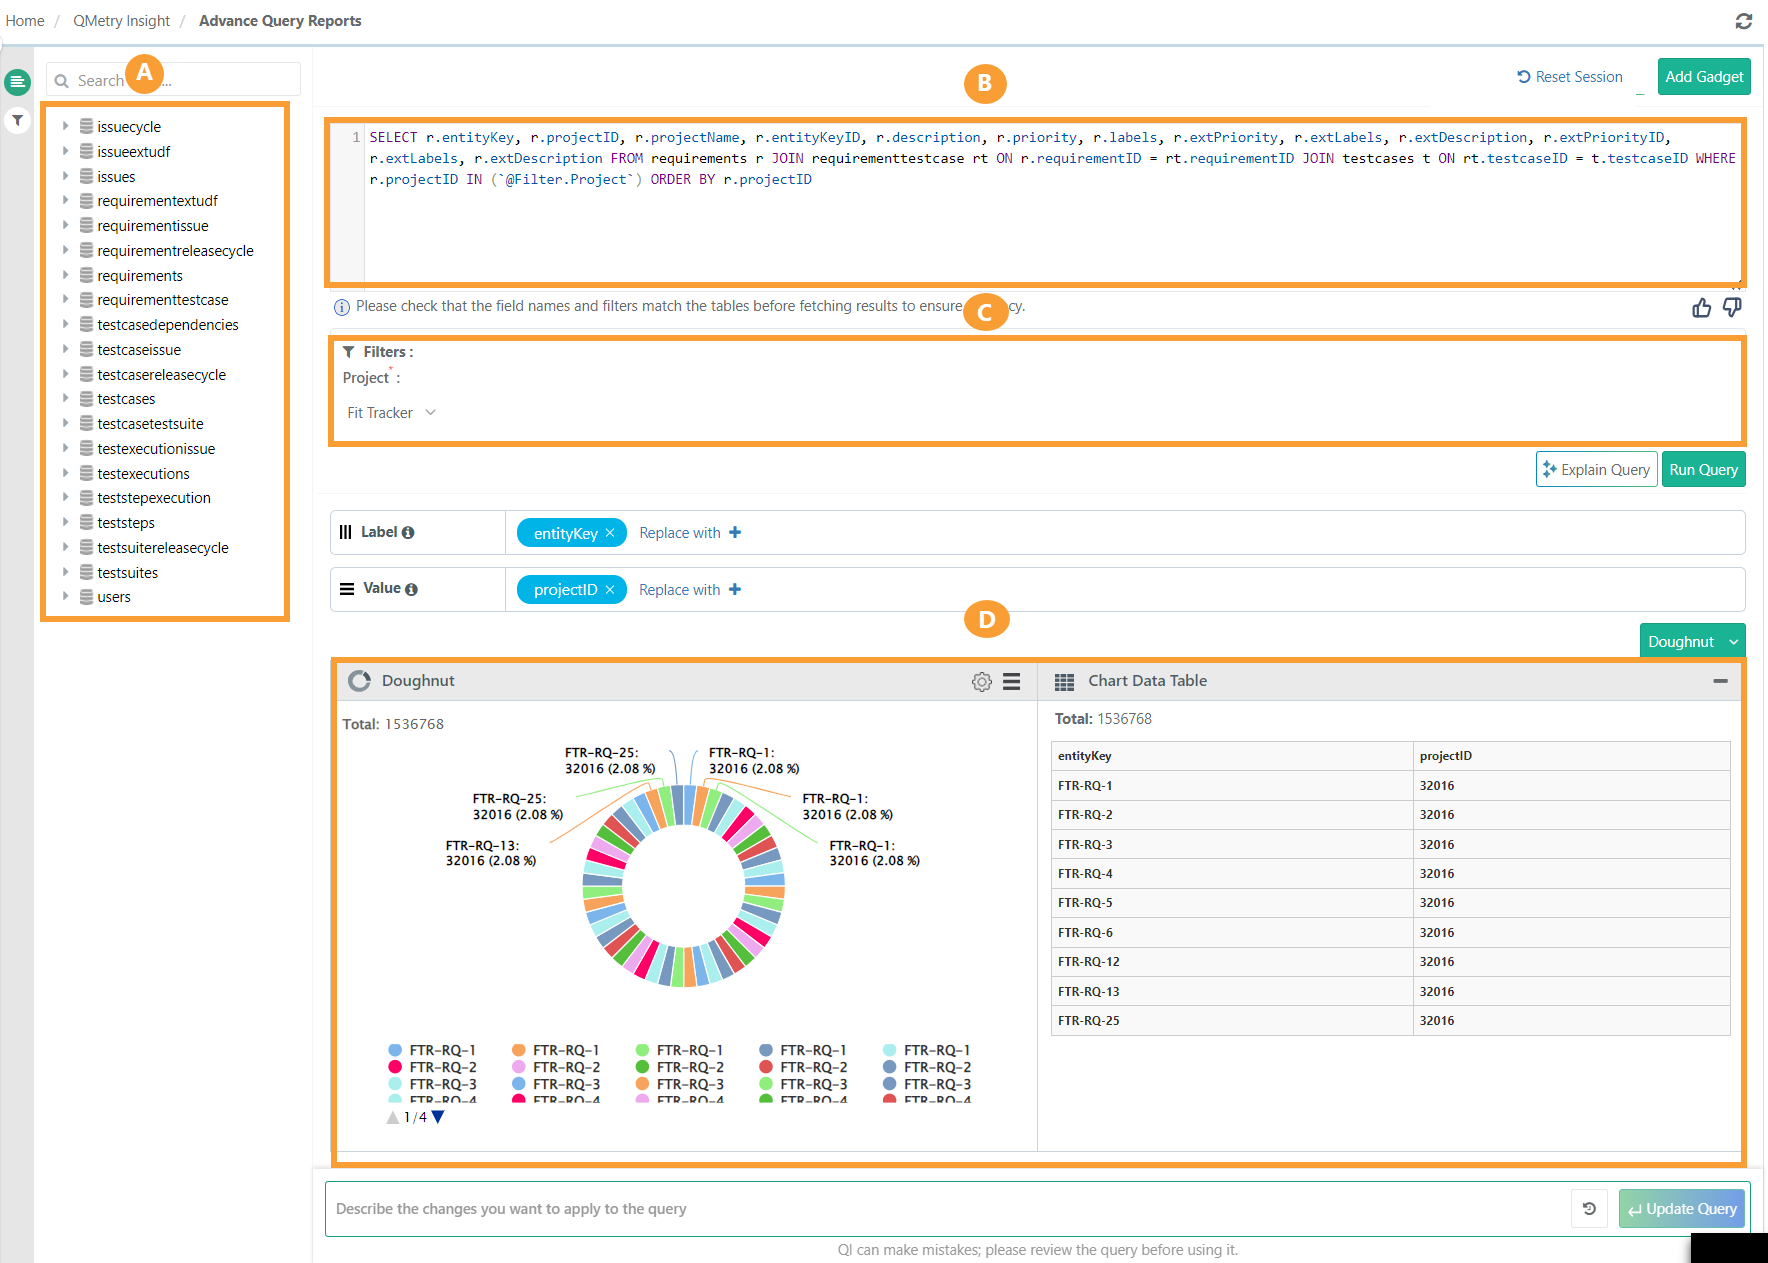
The screen is divided into four parts:
A. View Report Schema DB Tables
B. Query Builder
C. Filter panel
D. Result panel
 |
Database Schema / Entity Relationship Diagram
The following is the database schema to view the entity-relationship diagram for advanced query reports.
QMetry Insight lists tables and their fields on the left panel. The panel contains the consolidated QMetry data in 15 tables which are synced in real-time. For making the query creation easier, the names of the tables resembles QMetry test assets and different modules.
Note
In Requirements and Issues tables, field names having "Jira" as prefix are renamed with “Ext” prefix.
| Fields with this icon indicate the Type - varchar. |
| Fields with this icon indicate the Type - bigint or int. |
| Fields with this icon indicate the Type - text. |
| Fields with this icon indicate the Type - datetime. |


Expanding the table displays all associated fields in it. Hover over the fields to display the field's Type and Size.
Here is a quick overview of tables available as part of the report schema and the kind of data stored on it:
Table Name | Details |
issues | Details of QMetry and external issues. |
issuecycle | Details of cycles associated with issues. |
issueextudf | Details of custom fields of external tracker mapped with the Issue module. The table is available only if you have opted for the Advanced Reports App. |
requirementissue | Details of issues linked with requirements. |
requirementextudf | Details of custom fields of external tracker mapped with the Requirement module. The table is available only if you have opted for the Advanced Reports App. |
requirementreleasecycle | Details of release and cycle associated with a requirement version. |
requirements | Details of QMetry and Jira requirements. |
requirementtestcase | Details of Testcases linked to requirements. |
testcaseissue | Details of issues directly linked with test cases without execution. The table is provided to enable the creation of reports containing defects linked directly to the test case. |
testcasereleasecycle | Details of release and cycle associated with a test case version. |
testcases | All the test case details. |
testcasetestsuite | Details of test cases linked with test suites. |
testexecutionissue | Details of issues found during executions. |
testexecutions | Testcase execution details. |
teststepexecution | Execution details of a Test case - steps. |
teststeps | All the details of test case - steps. |
testsuitereleasecycle | Details of release and cycle associated with test suites. |
testsuites | All the test suites details. |
users | All the details of users. All ids like createdBy, owner, executed by, etc will be mapped with `users` table to get the username, userAlias, fisrtname, lastname etc. |
Testcasefolder | Displays all folders associated with the test case, including the Folder Name, Folder Path, Test Case Folder ID, Test Case ID, and the archived status of each folder (if applicable). |
Custom Field and Advanced Report App
With the Advanced Reports App
Custom Fields (of Requirements and Issue modules) that are mapped to Jira or Azure appear in QMetry Insight tables when the Sync fields to Reports feature is enabled on the Integrations tab within the Integration module. Additional tables related to User-Defined Fields (UDFs) will also be displayed.
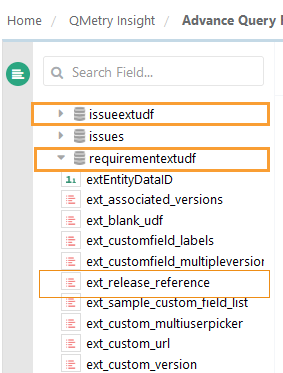
External custom fields of Issue Module appear in the issueextudf table.
External custom fields of Requirement module appear in the
requirementextudftable.
if you map an external custom field Release Reference to the Requirement module and enable sync, it appears as ext_release_reference in the requirementextudf table.
 |
Without Advance Reports App
Custom fields for Requirements and Issues modules that are mapped with Jira and Azure do not appear in QMetry Insight tables. Only synced QMetry Fields data and external tracker System Fields data are available for reports.
If you have not opted for the Advanced Reports App
The Insight table does not display Custom Fields (of Requirements and Issue modules) mapped with Jira and Azure. Only QMetry Fields data and external tracker System Fields data which are synced are available for generating reports.
Test Run UDFs
Test Run UDFs are user-defined fields configured at the test execution run level. These fields are available in the testexecutions table.
Each Test Run UDF appears in the testexecutions table as a column prefixed with qmetry_. For example, a UDF named severity_level appears as qmetry_severity_level.
You can reference Test Run UDF columns in SELECT, WHERE, GROUP BY, and ORDER BY clauses. The following example queries Execution Status and an Test Run UDF across a project:
Querying Test Run UDFs
SELECT
testexecutions.projectName AS "Project Name",
testexecutions.releaseName AS "Release Name",
testexecutions.cycleName AS "Cycle Name",
testexecutions.tcExecutionStatusName AS "Execution Status",
testexecutions.qmetry_severity_level AS "Severity Level"
FROM testexecutions
WHERE testexecutions.projectID IN (`@filter.project`)
ORDER BY testexecutions.releaseName, testexecutions.cycleName
Filtering on Test Run UDFs
You can filter report results using Execution UDF columns. The following example filters executions by a specific UDF value:
SELECT
testexecutions.projectName AS "Project Name",
testexecutions.tcExecutionStatusName AS "Execution Status",
testexecutions.qmetry_severity_level AS "Severity Level"
FROM testexecutions
WHERE testexecutions.projectID IN (`@filter.project`)
AND testexecutions.qmetry_severity_level = 'Critical'
Grouping and sorting on Test Run UDFs
You can apply GROUP BY and ORDER BY to Test Run UDF columns. The following example counts executions grouped by an Execution UDF and Execution Status:
SELECT
testexecutions.qmetry_severity_level AS "Severity Level",
testexecutions.tcExecutionStatusName AS "Execution Status",
COUNT(1) AS "Execution Count"
FROM testexecutions
WHERE testexecutions.projectID IN (`@filter.project`)
GROUP BY
testexecutions.qmetry_severity_level,
testexecutions.tcExecutionStatusName
Control Custom Fields Synced to Advanced Query Reports
System Admins can control which Jira or Azure custom fields are synchronized with QMetry Insight Advanced Query Reports. With this, admins can manage which external custom fields are available for reporting and prevents unnecessary data synchronization.
Limiting synced fields improves reporting performance, data reliability, and control over reporting data.
Configure Custom Fields for Reporting
To configure which custom fields are available in Advance Query Reports, do the following:
Note
The custom fields must be enabled in the project configuration for reporting.
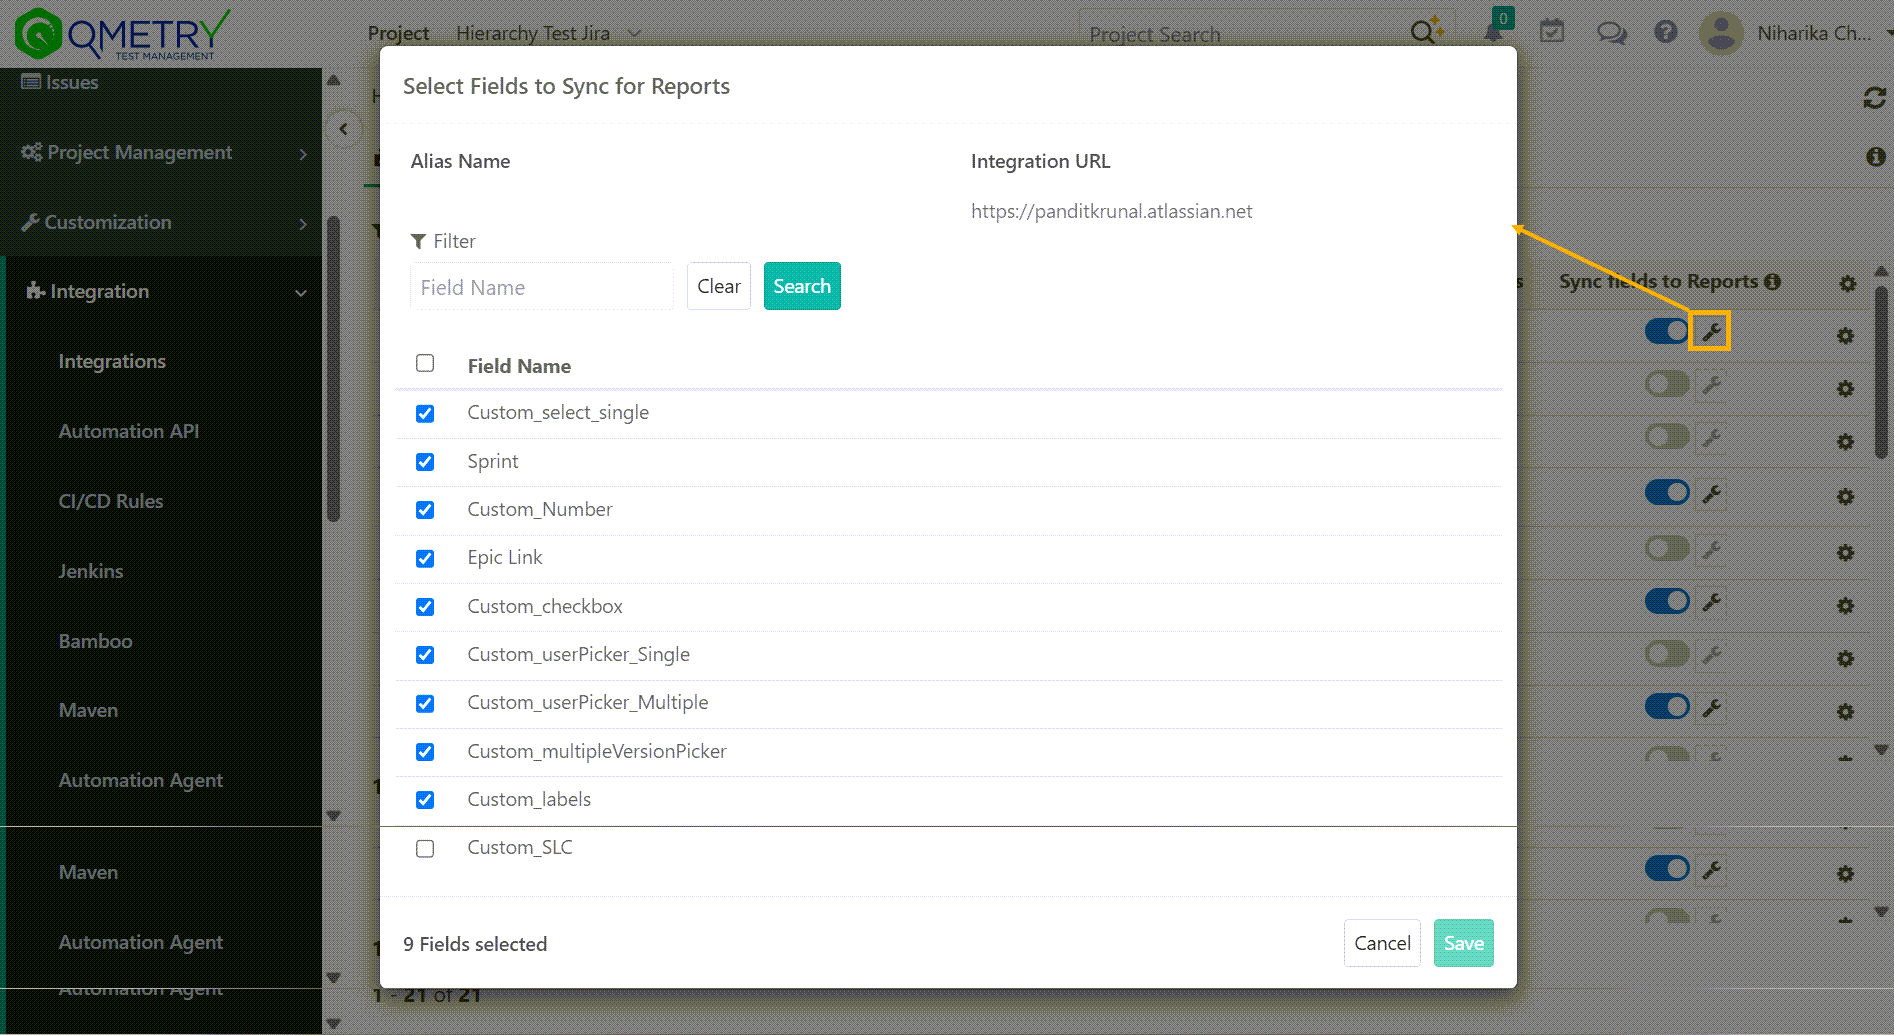
To configure custom fields for reporting, perform these steps:
Go to Integration.
Select the Jira or Azure integration.
Locate Sync fields to Reports.
Select the Configure icon.
Select the custom fields you want to make available for reporting.
Click Save.
Only the fields selected become available in Advanced Query Reports. You can add more fields later by updating the configuration.
Query Builder
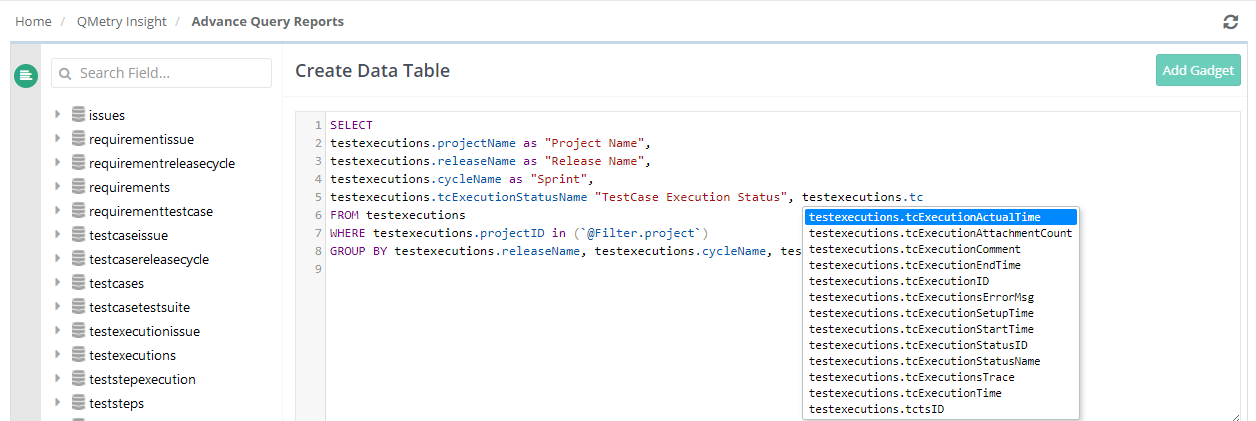
Query Builder allows you to write SQL statements like SELECT statements. While writing a query the query builder auto-suggest field names when the user inserts the table name and enters a dot (.), the field names of that tables are auto-suggest.
 |
In case of a syntax error in a query, the query builder provides an ability to identify the error through the SQL Syntax Validator.
Note
The system does not accept SELECT * clause. You must specify column names in the select statement.
The system does not accept UPDATE and DELETE queries.
You can apply Group By to custom fields and system fields of type text, including lookup, multi-lookup, fields. Custom fields include QMetry custom fields and external tracker fields synced with QMetry Insights.
Gadgets (other than tables) support up to 500 records. During execution, the query returns the first 500 records. All data is available in exported reports.
SQL queries support WITH clause, empowering users to build custom reports using Common Table Expressions (CTEs).
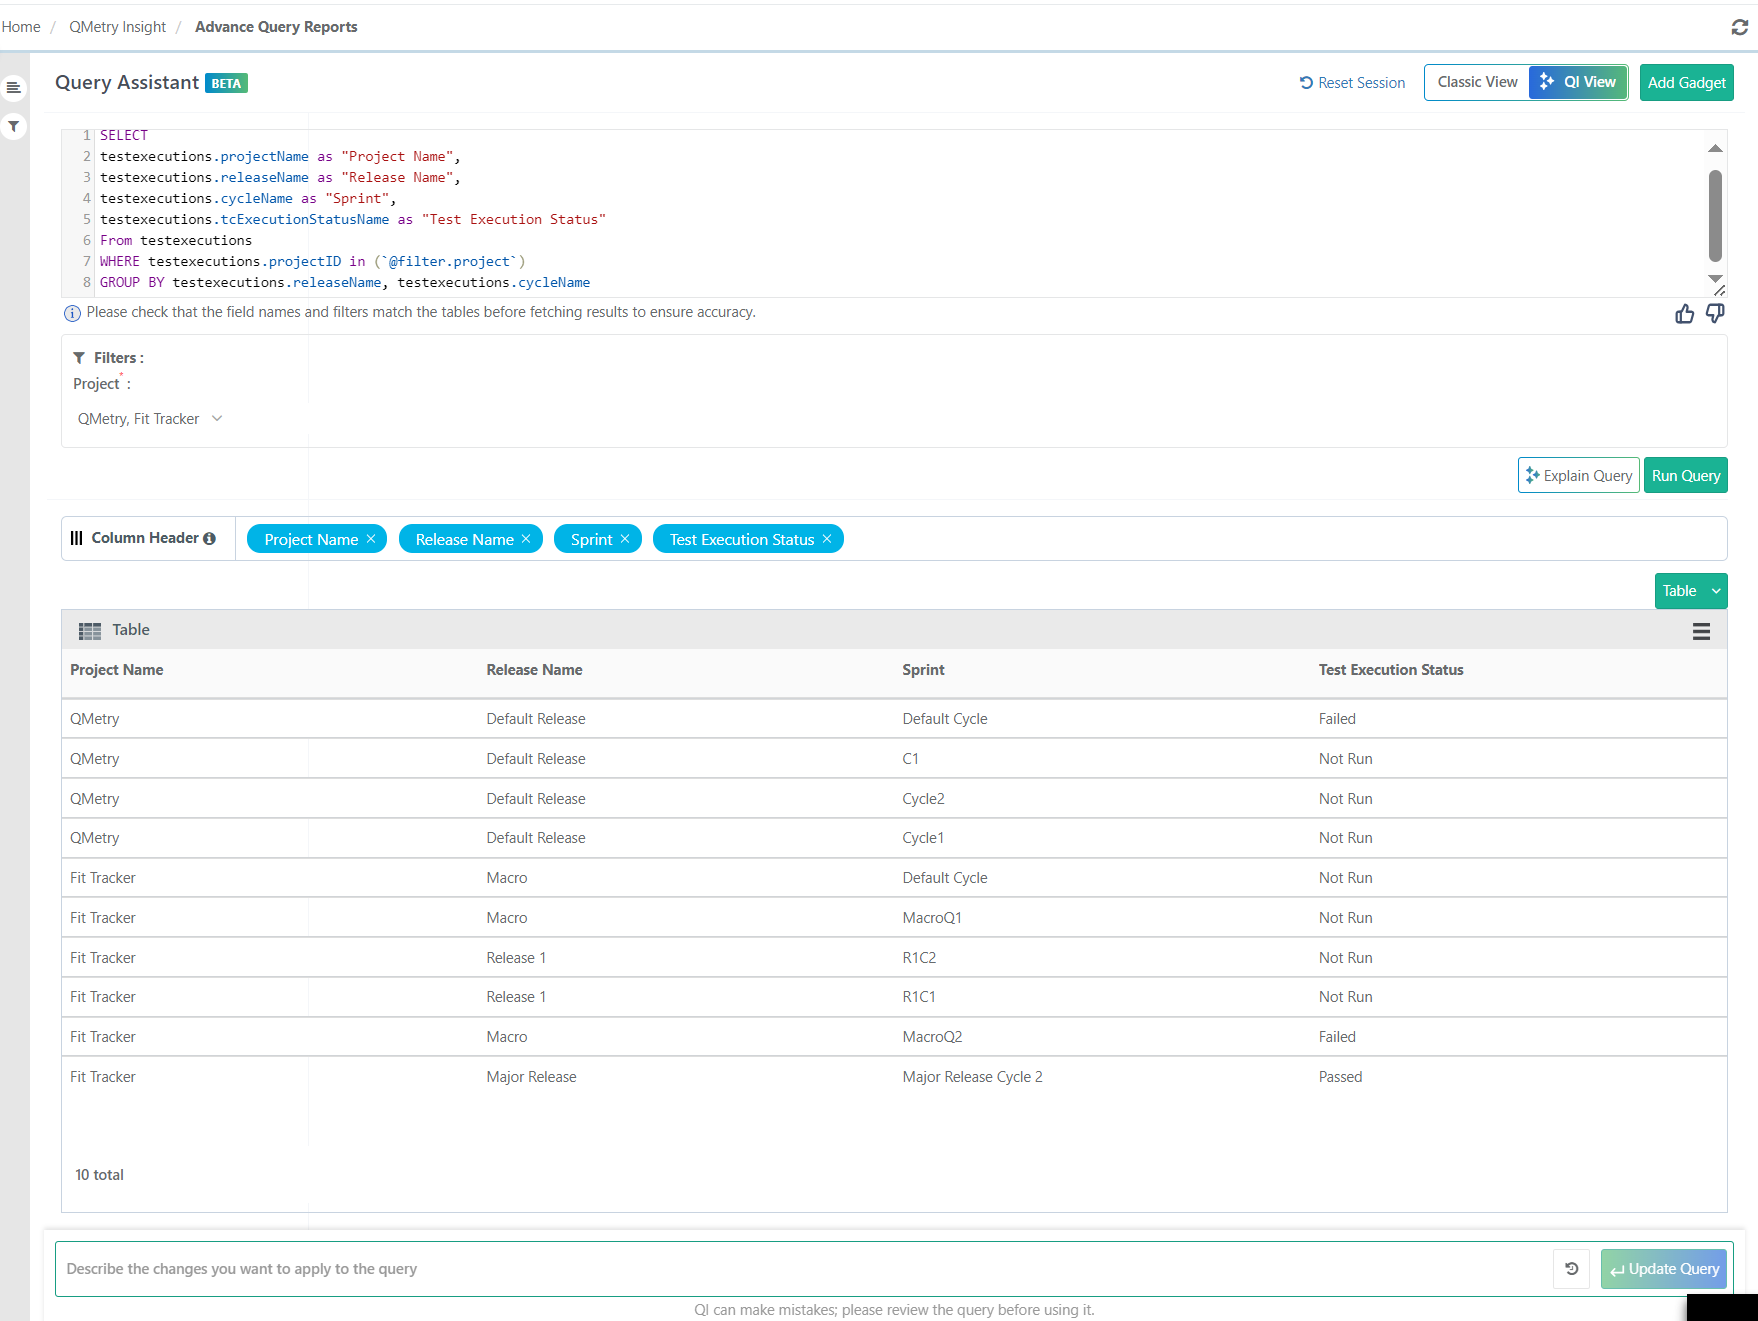 |
Handling null execution status for uncovered test cases
By default, the latest execution status for uncovered test cases is null. To display a different value, use the COALESCE function:
COALESCE (<fieldname>,'<statusvalue>')
 |
SELECT testcases.entityKey,
COALESCE (testcases.latestExecutionStatus, 'UnCovered')
FROM testcases
WHERE testcases.projectName =
'FitTracker';
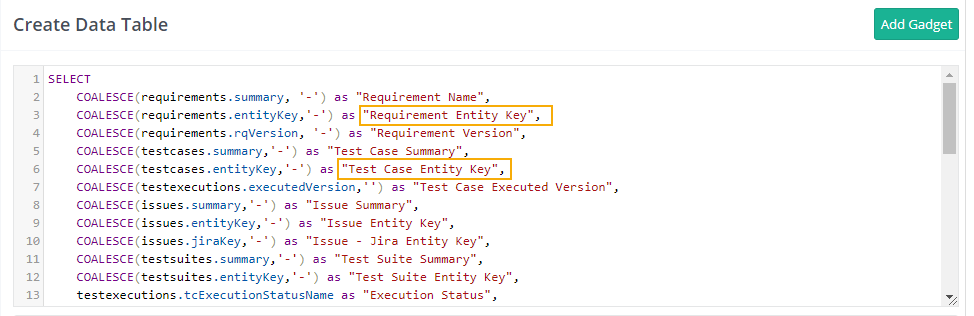
The test asset key becomes a clickable link in the report if the column name contains the phrase entity key in any format: entity key, entityKey, entity-key, or entity_key.
 |
 |
Adding Filters
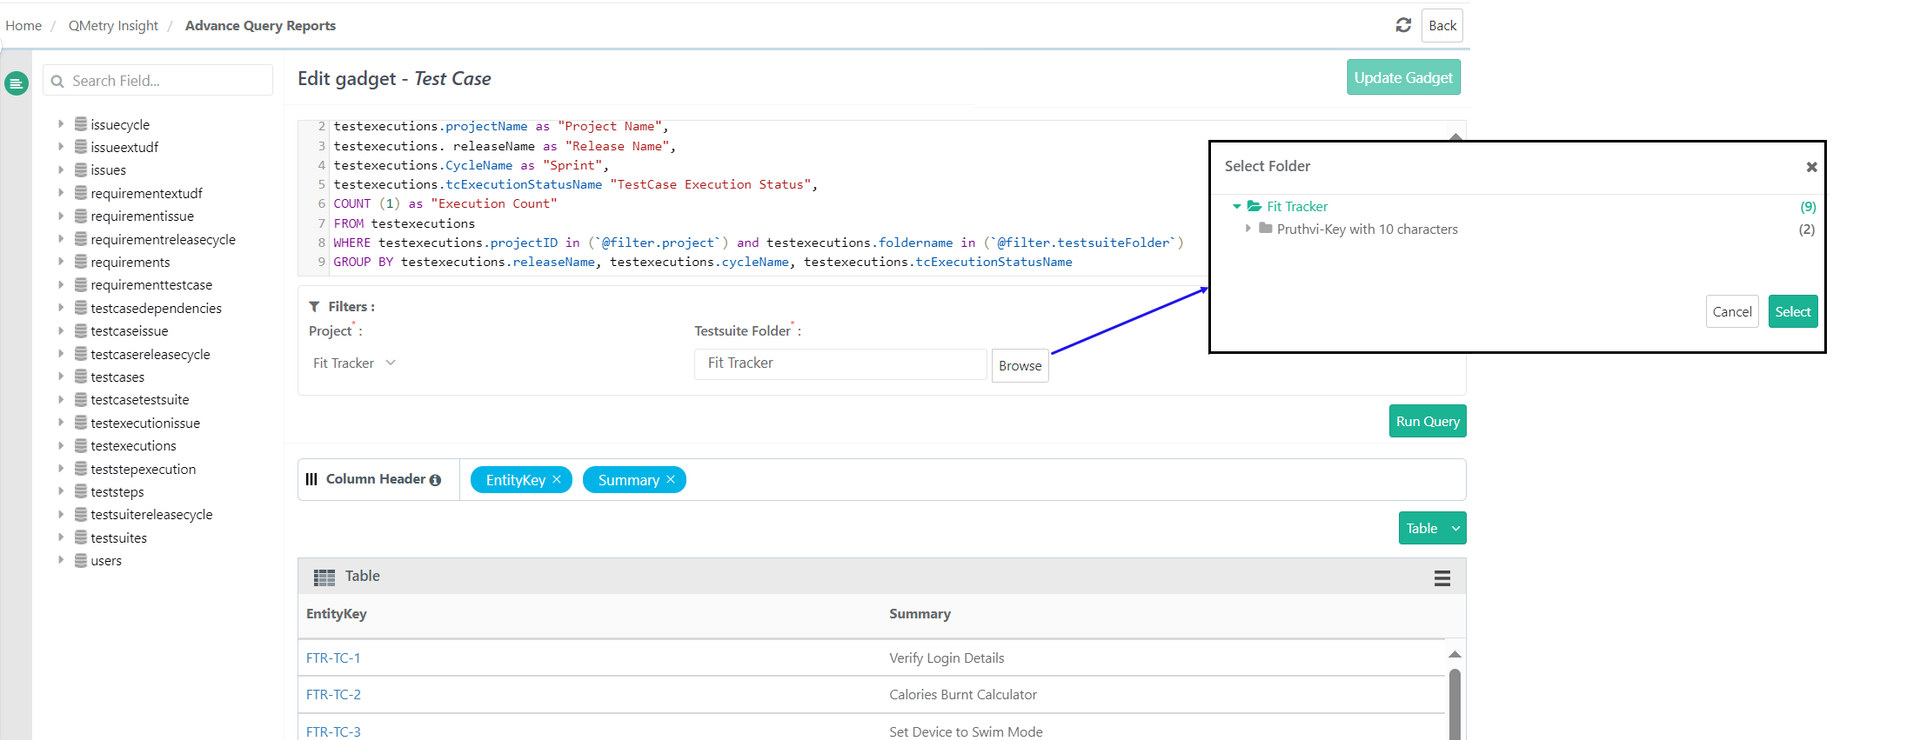
Filter reports by project and folder. The folder browse option supports both parent and subfolder selection. This feature is available for Requirements, Test Cases, and Test Suites, and works only when a single project is selected.
To fetch data from a specific folder, use the equals (=) operator:
SELECT requirements.entityKey, requirements.folderPath FROM requirements
WHERE requirements.projectID = @filter.Project
AND requirements.rqFolderID = @filter.RequirementFolder
To retrieve data from a folder and all its subfolders, use the IN operator:
SELECT requirements.entityKey, requirements.folderPath
FROM requirements
WHERE requirements.projectID = `@filter.Project`
AND requirements.rqFolderID IN (`@filter.RequirementFolder`)
Single Project Selection:
When you select a single project, the folder filter remains active. You can further refine results by folder structure.
 |
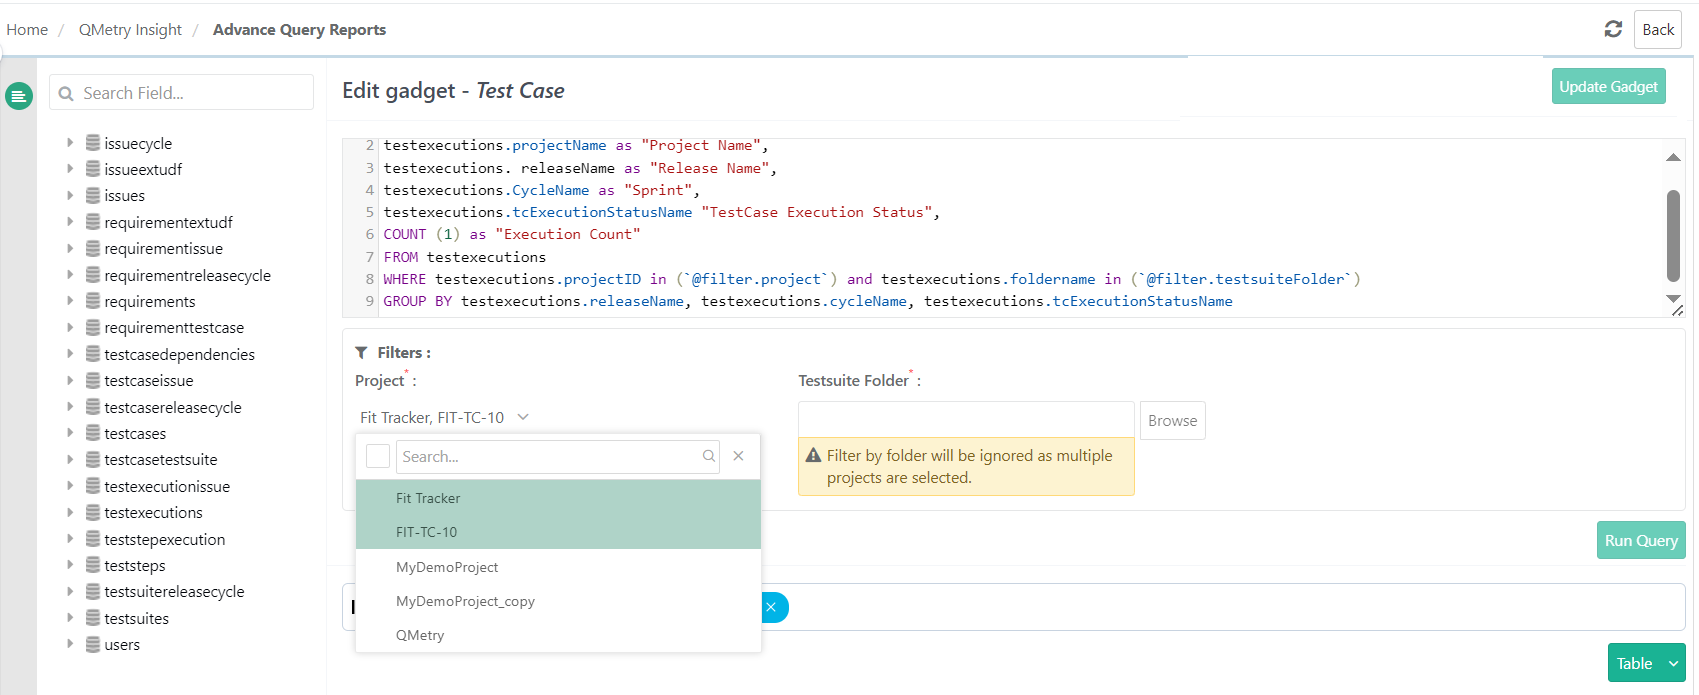
Multi-project Selection
When you select multiple projects, the system disables the folder filter. Folder-based filtering is not available across multiple projects.
 |
Refer to the attached link for more details on System Filters Available for Query.
Gadget Charts
On the Result panel, select the report type you want to preview the report.
Here is an explanation on Types of Gadget Charts supported along with examples.
Saving Gadgets
After you run a query, select Add Gadget to save the report and add it to a dashboard. The system saves the gadget to QMetry Custom Gadget.
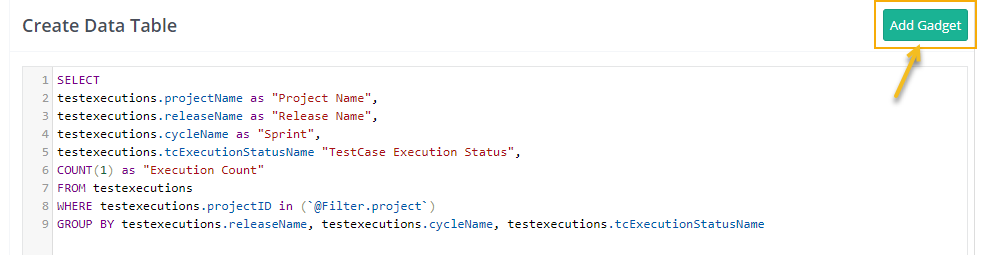
The system adds the gadget to QMetry Custom Gadget section.
Customizing Chart Colors
Use Chart Settings to customize the appearance of any chart. You can change legend colors and show or hide legends and axis labels.
Write the query
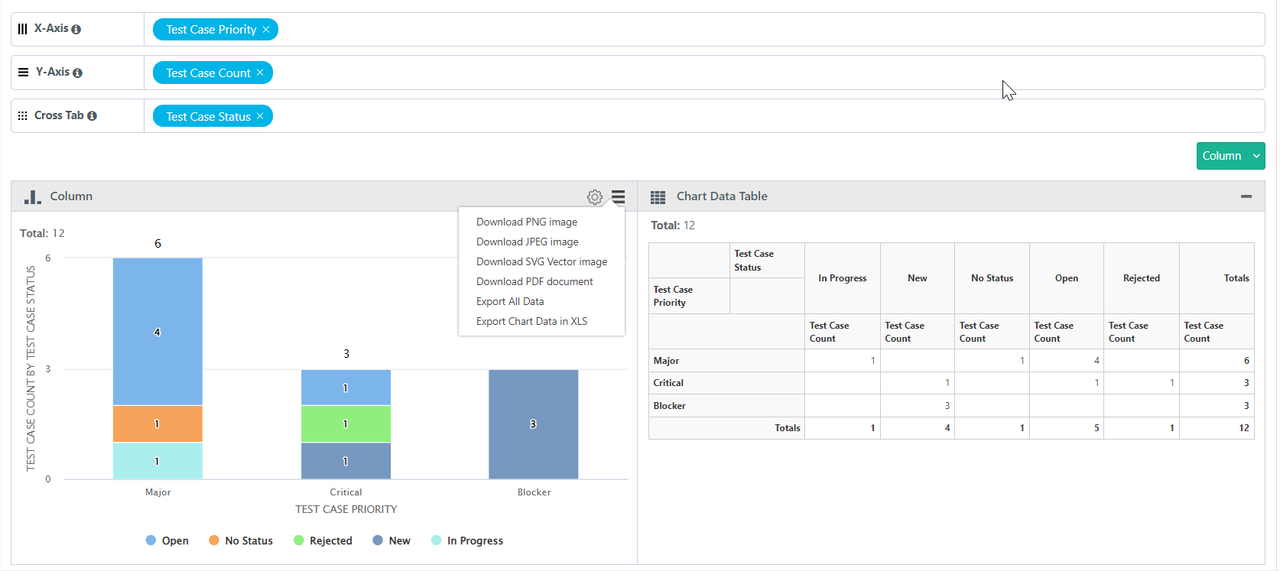
The following query counts test cases by status and priority, producing output suitable for a stacked bar chart:
SELECT
count(1) as "Test Case Count",
COALESCE(testcases.priority, 'No Priority') as "Test Case Priority",
COALESCE(testcases.testCaseStatus, 'No Status') as "Test Case Status"
FROM testcases
WHERE testcases.projectID in (`@filter.project`)
GROUP BY testcases.priority, testcases.testCaseStatus
Configure the chart layout
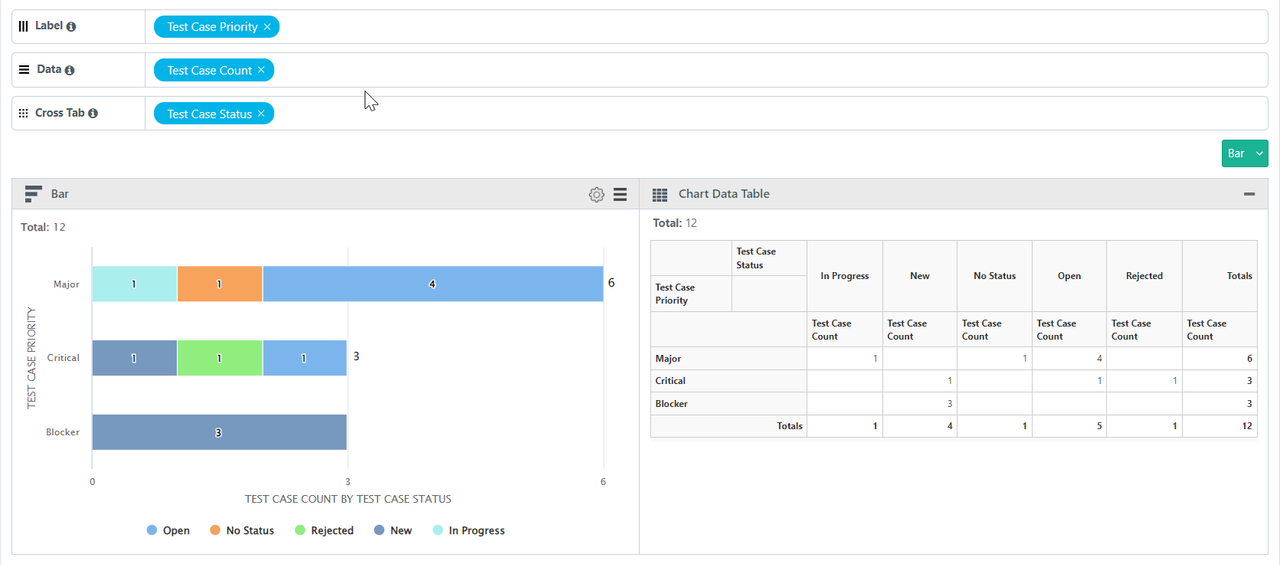
The query output appears in Table format by default. To switch to a chart, select a chart type from the Result panel. Then assign columns to the chart sections:
Label: A single test entity field with any value.
Data: Fields with numeric values. Adding multiple fields creates a stacked chart.
Cross Tab: Creates a Group Stacked chart.
Customize Chart Colors
To customize the chart's appearance, do the following:
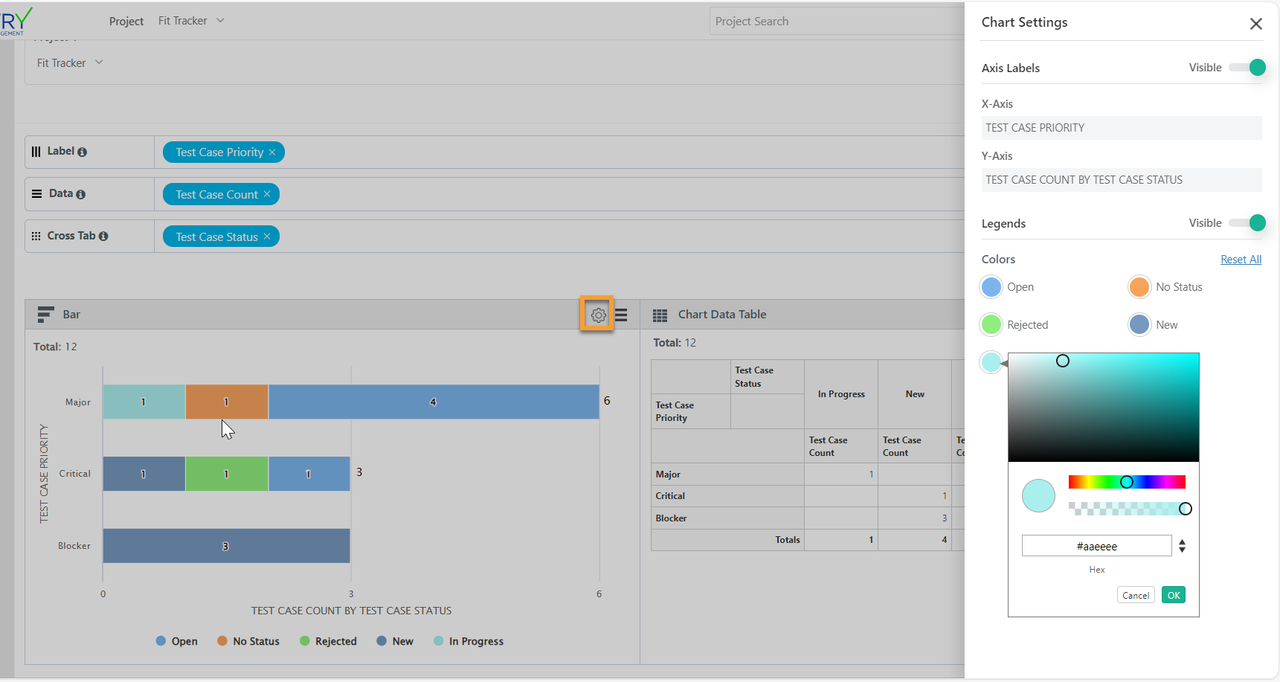
Select the cog icon on the graph. The Chart Settings panel opens.
To change a legend color, select its color swatch and choose a new color.
To show or hide a legend, toggle its Visible setting.
To show or hide axis labels, toggle the axis label Visible setting.
To revert all color changes to system defaults, select Reset All under the Colors section.
Note
Execution Status legend colors are controlled by Customization > Execution Status. The color option in Chart Settings is disabled for these legends.
Editing Gadgets
The gadgets created in Advance Query Reports can be edited from the QMetry Custom Gadget.
To edit a gadget, do the following:
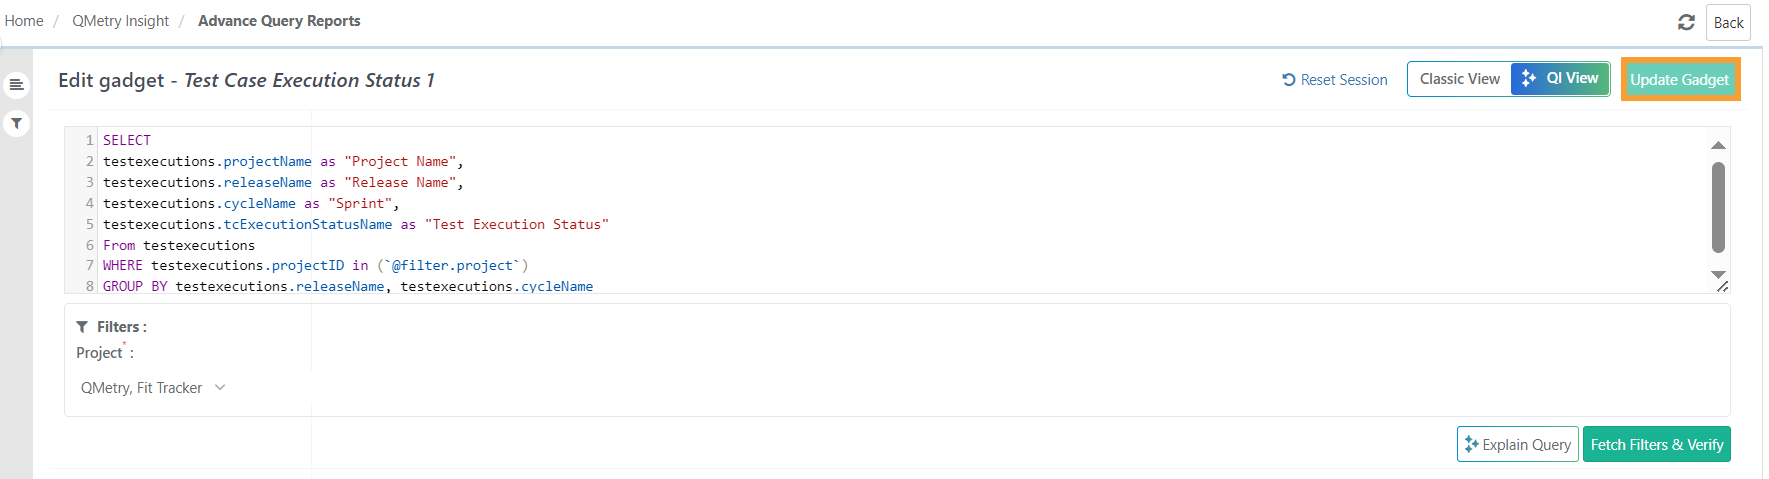 |
Go to QMetry Custom Gadget and select the My Gadget tab.
Select the Edit icon for the gadget to update. The system opens the Advance Query Reports SQL query builder for that gadget.
Exporting Gadget Data
You can export individual gadget data or chart images in multiple formats.
Export limits
Excel exports support up to 1,000,000 records per export.
Individual gadget CSV exports use the same limit.
Export Formats
Download chart images in PNG, JPEG, SVG Vector, or PDF.
Export All Data: Schedules an Export Report task. View the scheduled job in the Scheduled Task section and download the output as a CSV.
Export column Data in XLS: Downloads the Chart Data Table as an XLS file.
You can also export all custom dashboard gadgets through an API call.
 |
Best Practices
Provide rights to write custom quesries only to those users who have knowledge of writing SQL queries and can access any QMetry data, as there is direct access to all QMetry data in Report Schema DB.
The custom SQL queries must always include a project filter specified as: @FILTER.PROJECT. This prevents the recipients of the shared report gadgets from inadvertently viewing data from other projects that they do not have access to.
The custom SQL report queries after creation must be run and saved against a Sample Project, so that the report does not load with the data of an un-intended project.
The Report DB has tables like testcase, testexecutions, etc. which now only have user IDs instead of the actual information of the users. This information should be queried by writing an SQL Join with user IDs from `users` table now available in the Report DB schema.